
Energy Pie Charts
Pie Charts show which part of the plant is using what percentage of the total energy
Pie Charts show which part of the plant is using what percentage of the total energy
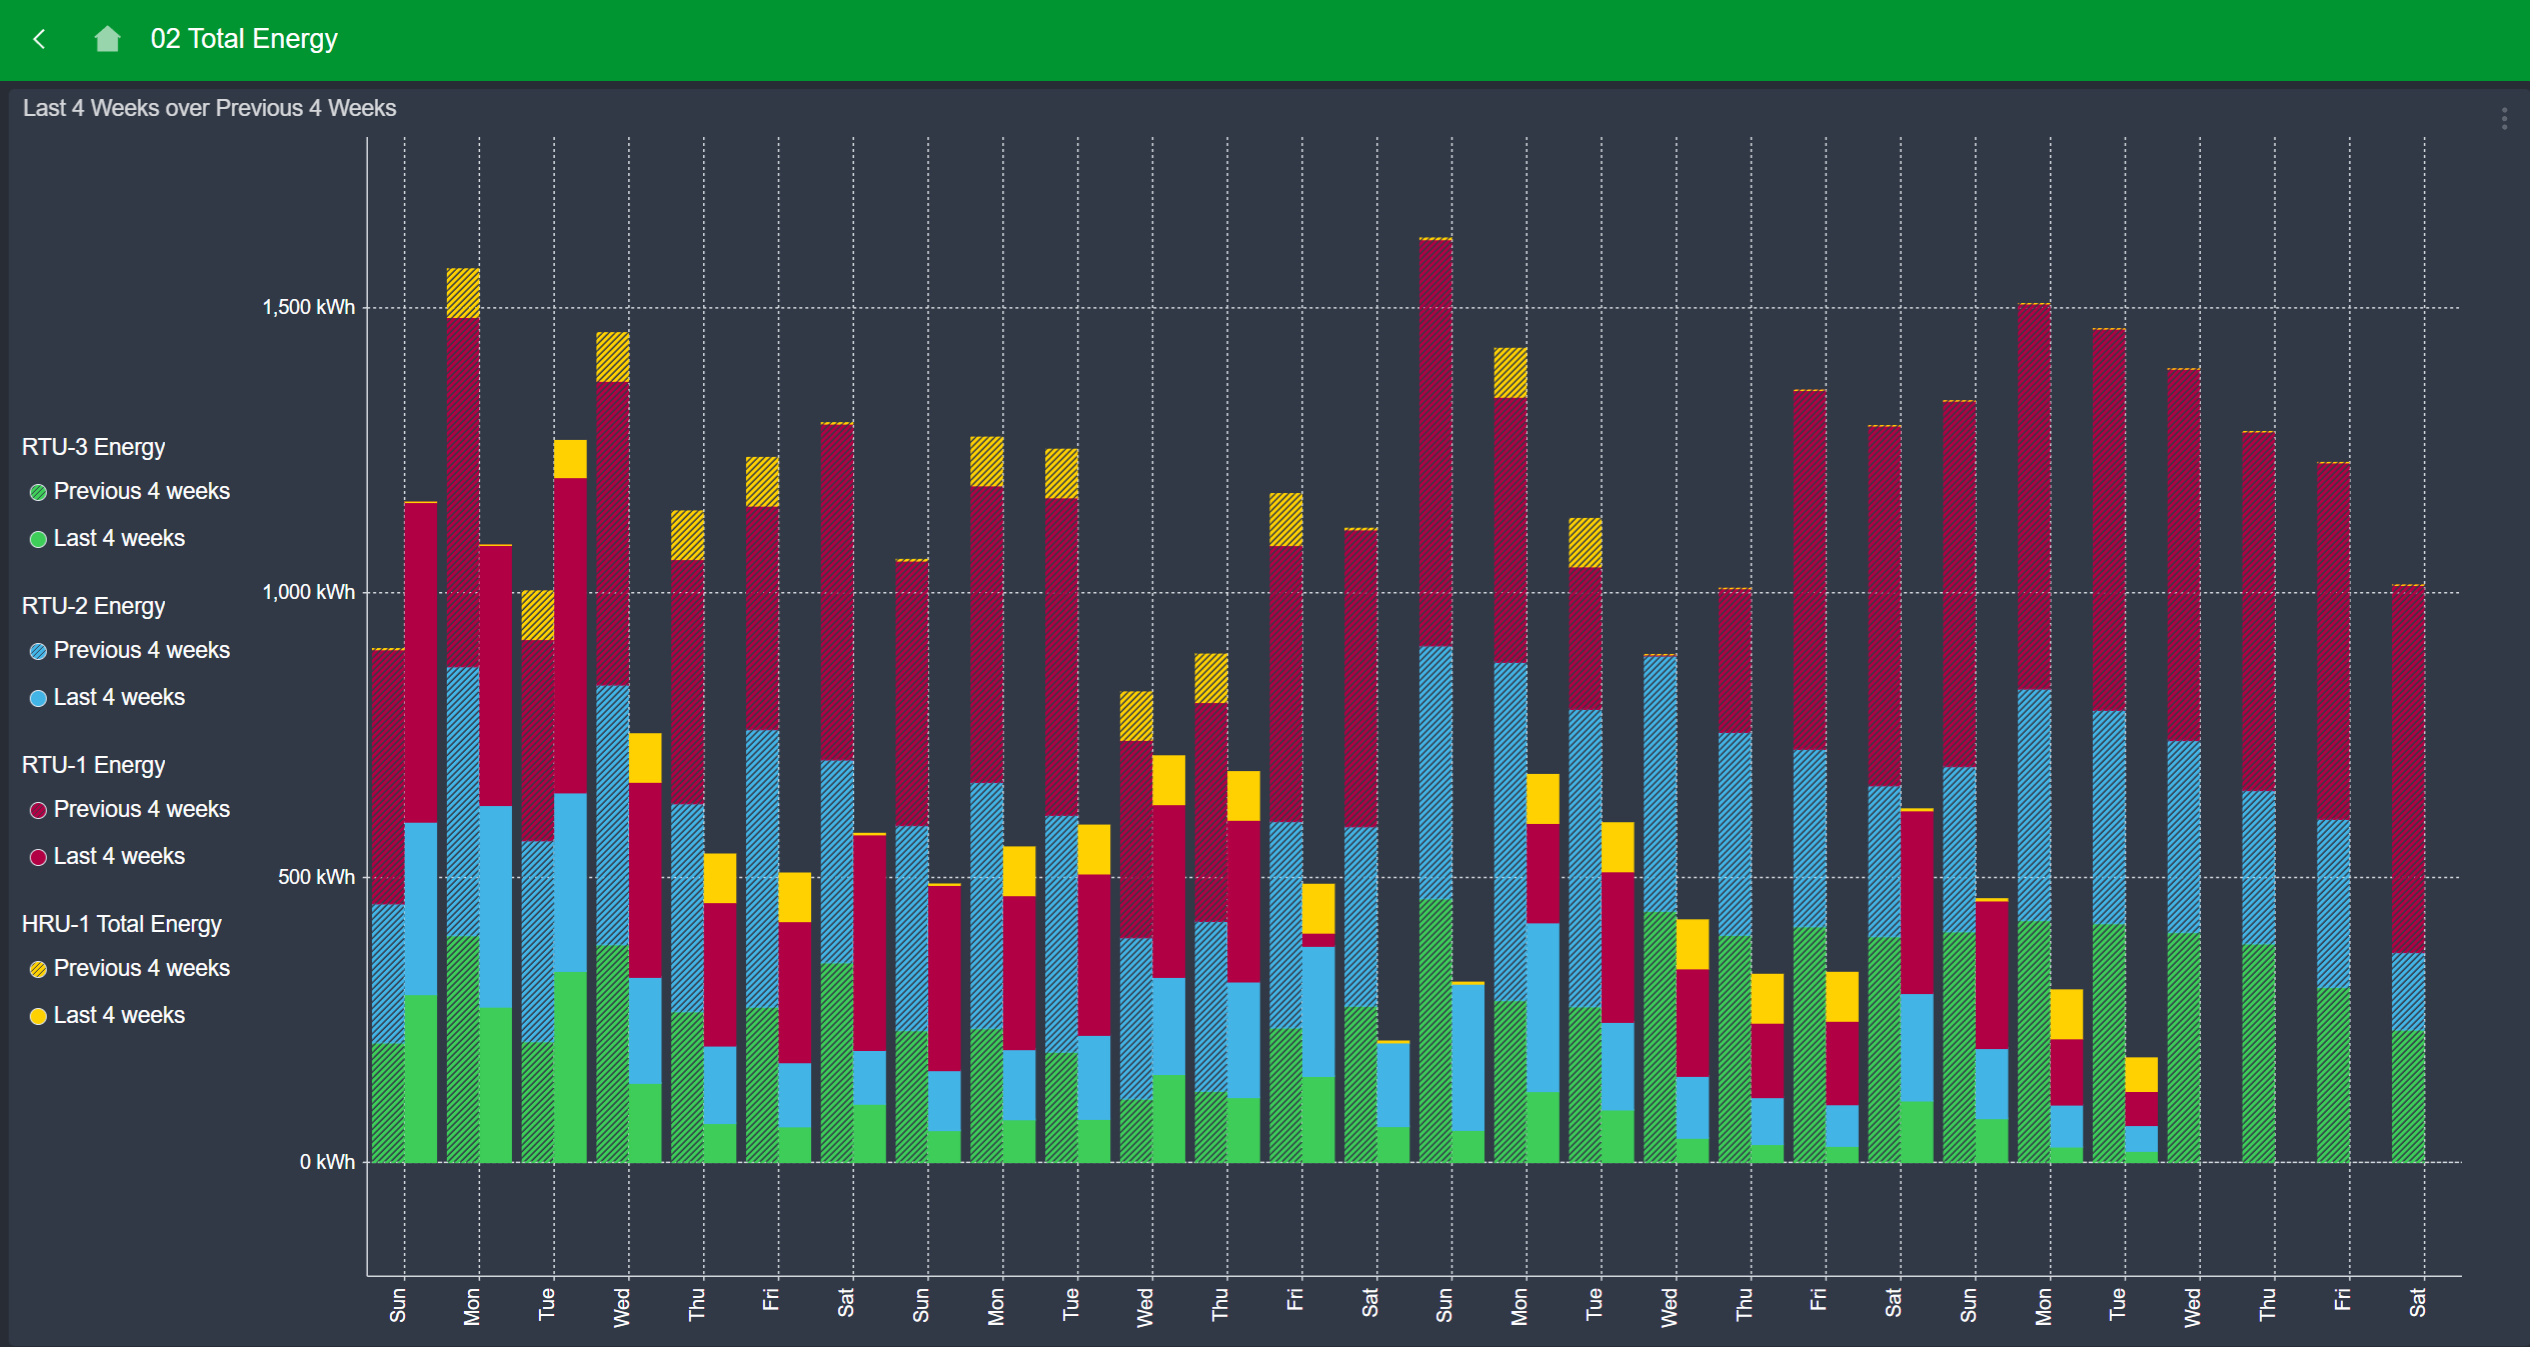
Stacked charts provide additional visualization

Comparing one period to another in a before and after fashion show the impact of energy reduction efforts

A heat-map chart can indicate when the peak power events are occuring to help better manage costs

Double-row low temp radiators allow the same BTUh output at low temperatures to take advantage of condensing boilers